Introduction:
In my quest to find a reliable tool that can show per-process swap usage, I stumbled upon a program called smem. Although smem does the job well, it took around 1.5 seconds to run, with the runtime depending on the number of open processes. smem works by parsing /proc/<pid>/smaps and summing specific fields. To improve upon this, I developed my own version called zmem, inspired by memory management mechanics like zram and zswap. My initial Rust implementation already showed a significant performance boost, taking approximately 600ms to run. However, I wanted to optimize it further to create a continuous monitoring software. In this blog post, I will describe my journey of optimizing zmem and the techniques I employed to achieve it.
Initial Rust Implementation:
As a newcomer to Rust, I started by writing a simple implementation of zmem. I followed a similar approach as smem, but aimed to optimize it from the very beginning. My initial implementation took around 600ms to run, which was already a significant improvement over smem. However, I wanted to push the limits and achieve even better performance.
Here’s a snippet of the initial implementation:
pub struct ProcessMemoryStats {
    pub pid: u32,
    pub username: String,
    pub command: String,
    pub swap: u64,
    pub uss: u64,
    pub pss: u64,
    pub rss: u64,
}

impl ProcessMemoryStats {
...
    pub fn update(&mut self, pid: u32) -> Result<(), AnyError> {
        let mut file = File::open(format!("/proc/{}/cmdline", pid))?;
        let mut contents = String::new();
        file.read_to_string(&mut contents)?;
        self.command = contents.replace("\0", " ");
        if self.command.len() > 50 {
            self.command.truncate(50);
        }
        self.pid = pid;
        let mut file = File::open(format!("/proc/{}/smaps", pid))?;
        let mut contents = String::new();
        file.read_to_string(&mut contents)?;
        let lines: Vec<&str> = contents.lines().collect();
        for line in lines {
            let mut split = line.split_whitespace();
            let key = split.next().ok_or("bad file format")?;
            let value = split.next().ok_or("bad file format")?;
            match key {
                "Swap:" => self.swap += value.parse::<u64>()?,
                "Pss:" => self.pss = value.parse()?,
                "Rss:" => self.rss = value.parse()?,
                "Private_Clean:" => self.uss += value.parse::<u64>()?,
                "Private_Dirty:" => self.uss += value.parse::<u64>()?,
                _ => (),
            }
        }

        Ok(())
    }
...
}
Profiling with Cargo Flamegraphs:
To identify bottlenecks in my code, I turned to Cargo’s built-in flamegraphs. Generating a flamegraph was as easy as running cargo flamegraph. The flamegraph helped me visualize the performance of different parts of my code.
Optimizing Update Function:
One of the first issues I discovered was that I was calling the update function twice, without any apparent reason. By removing one of the redundant calls, I managed to bring the runtime down to around 300ms.
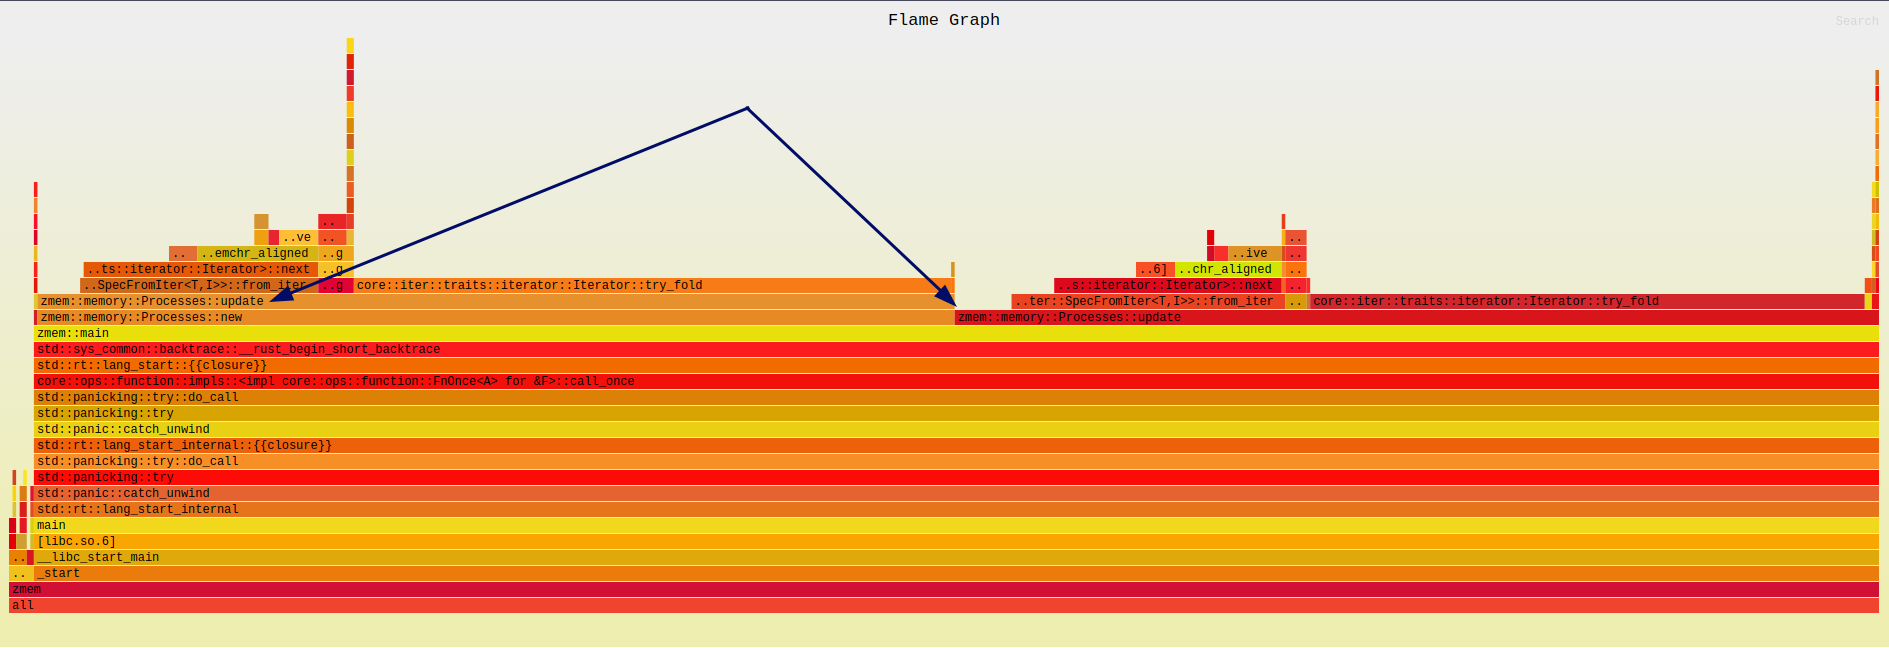
Parallelizing Update Function:
Next, I parallelized the Update function using tokio, so that each reading operation on /proc/<pid>/smaps was performed asynchronously. This change resulted in a significant performance improvement, reducing the runtime to just 70ms.
pub async fn update(&mut self) -> Result<(), AnyError> {
   let mut processes = vec![];
   for entry in fs::read_dir("/proc")? {
       let entry = entry?;
       let pid = entry
           .file_name()
           .into_string()
           .unwrap_or_else(|_| "".to_string());
       if let Ok(pid) = pid.parse::<u32>() {
           if let Ok(command) = Process::get_cmd(pid) {
               if !command.is_empty() && Self::can_read_file(&format!("/proc/{}/smaps", pid)) {
                   let process_fut = async move { Process::new(pid) };
                   let process = task::spawn(process_fut);
                   processes.push(process);
               }
           }
       }
   }
   let mut processes = futures::future::join_all(processes).await;
   processes.sort_by(|a, b| {
       a.as_ref()
           .unwrap()
           .memory
           .swap
           .cmp(&b.as_ref().unwrap().memory.swap)
   });
   self.processes = processes.into_iter().map(|p| p.unwrap()).collect();
   Ok(())
}
All I did was make the call to new process asynchronous.
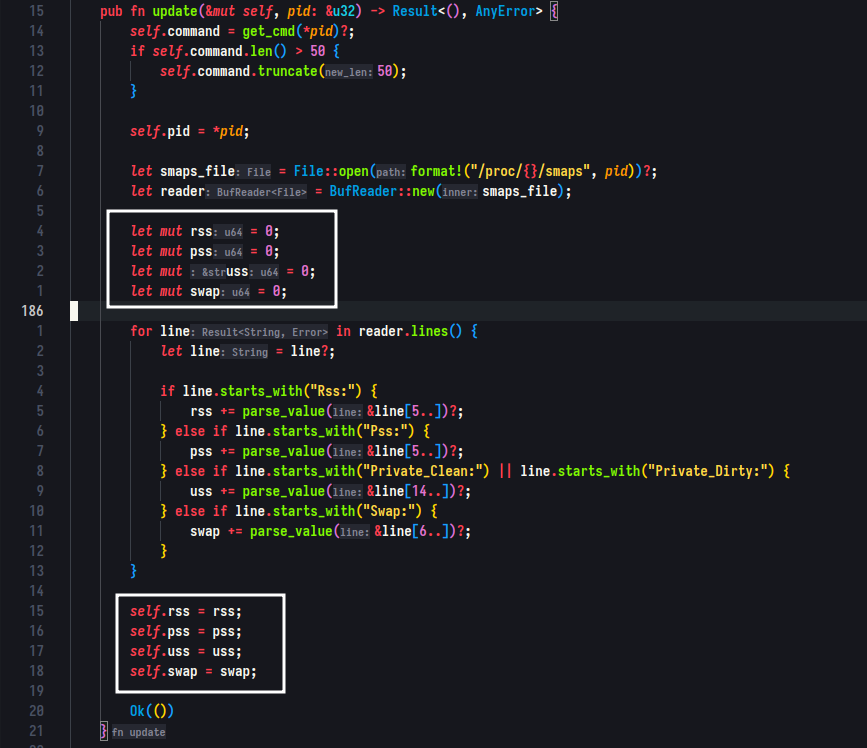
Improving Data Locality:
In an effort to further optimize the program, I added local variables where resources were being summed after parsing the smaps file. By doing this, I improved data locality, which in turn improved the performance of my code.
Including Debug Information:
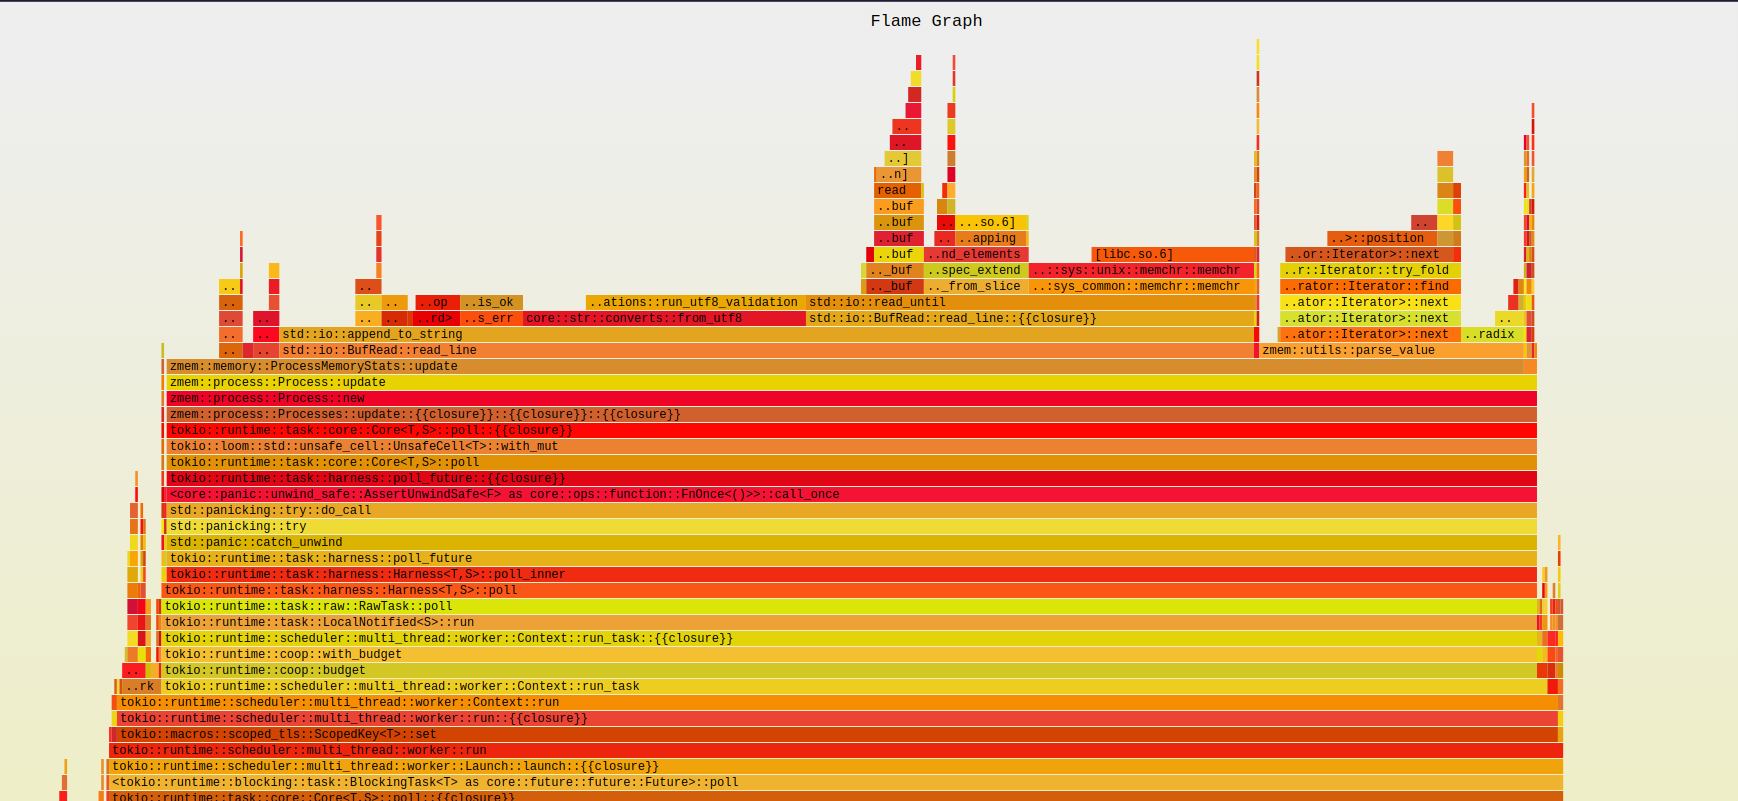
I realized that my release profile did not include debug information, which limited the output of the flamegraphs and excluded a lot of symbol data. By adding debug=true to the release profile, I was able to obtain more detailed information about which parts of my program were taking longer to execute.
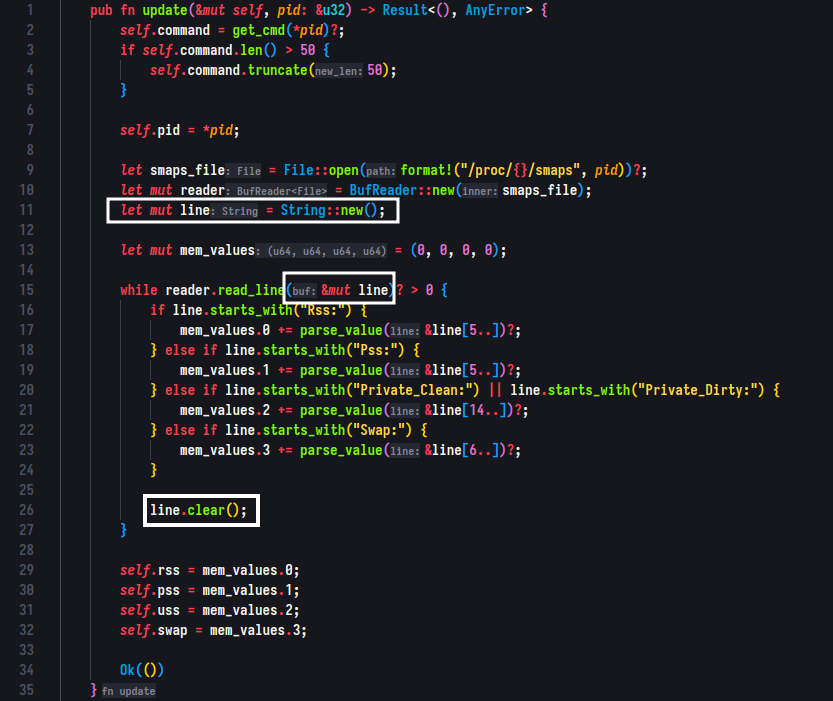
Utilizing filter_map and Reusing String:
To further optimize my code and make it cleaner, I started using filter_map in some sections. Additionally, I realized I was creating a new line string for each iteration, leading to repeated calls to the allocator. By reusing the same string and clearing it after each iteration, I managed to improve performance by 5-10%.
Switching to smaps_rollup:
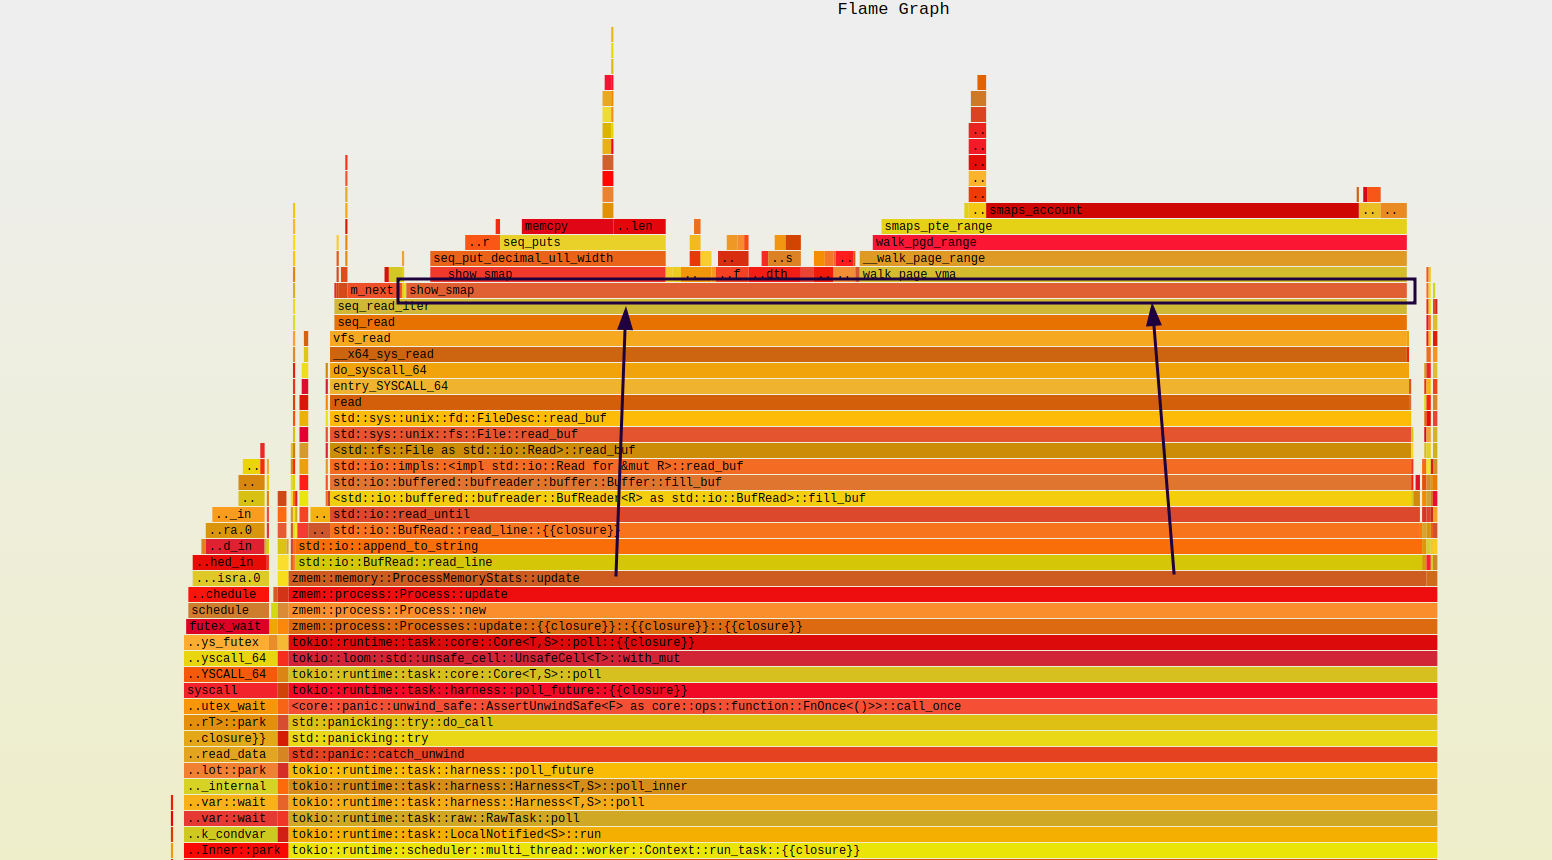
While implementing smaps to read data about processes, I initially assumed that it was the best option available. However, during my research, I discovered that the slowness of smaps had been a concern for others as well. To further complicate things, I found out that the default value of kernel.perf_event_paranoid was 2, which made my flamegraphs inaccurate. After setting it to 1, I noticed that the call to __show_smap was taking the most time. For more information about the kernel.perf_event_paranoid sysctl value, refer to https://sysctl-explorer.net/kernel/perf_event_paranoid/.
Before:
After:
/* Show the contents common for smaps and smaps_rollup */
static void __show_smap(struct seq_file *m, const struct mem_size_stats *mss,
	bool rollup_mode)
{
	SEQ_PUT_DEC("Rss:            ", mss->resident);
	SEQ_PUT_DEC(" kB\nPss:            ", mss->pss >> PSS_SHIFT);
	SEQ_PUT_DEC(" kB\nPss_Dirty:      ", mss->pss_dirty >> PSS_SHIFT);
	if (rollup_mode) {
		/*
		 * These are meaningful only for smaps_rollup, otherwise two of
		 * them are zero, and the other one is the same as Pss.
		 */
		SEQ_PUT_DEC(" kB\nPss_Anon:       ",
			mss->pss_anon >> PSS_SHIFT);
		SEQ_PUT_DEC(" kB\nPss_File:       ",
			mss->pss_file >> PSS_SHIFT);
		SEQ_PUT_DEC(" kB\nPss_Shmem:      ",
			mss->pss_shmem >> PSS_SHIFT);
	}
	SEQ_PUT_DEC(" kB\nShared_Clean:   ", mss->shared_clean);
	SEQ_PUT_DEC(" kB\nShared_Dirty:   ", mss->shared_dirty);
	SEQ_PUT_DEC(" kB\nPrivate_Clean:  ", mss->private_clean);
	SEQ_PUT_DEC(" kB\nPrivate_Dirty:  ", mss->private_dirty);
	SEQ_PUT_DEC(" kB\nReferenced:     ", mss->referenced);
	SEQ_PUT_DEC(" kB\nAnonymous:      ", mss->anonymous);
	SEQ_PUT_DEC(" kB\nLazyFree:       ", mss->lazyfree);
	SEQ_PUT_DEC(" kB\nAnonHugePages:  ", mss->anonymous_thp);
	SEQ_PUT_DEC(" kB\nShmemPmdMapped: ", mss->shmem_thp);
	SEQ_PUT_DEC(" kB\nFilePmdMapped:  ", mss->file_thp);
	SEQ_PUT_DEC(" kB\nShared_Hugetlb: ", mss->shared_hugetlb);
	seq_put_decimal_ull_width(m, " kB\nPrivate_Hugetlb: ",
				  mss->private_hugetlb >> 10, 7);
	SEQ_PUT_DEC(" kB\nSwap:           ", mss->swap);
	SEQ_PUT_DEC(" kB\nSwapPss:        ",
					mss->swap_pss >> PSS_SHIFT);
	SEQ_PUT_DEC(" kB\nLocked:         ",
					mss->pss_locked >> PSS_SHIFT);
	seq_puts(m, " kB\n");
}
Relevant section of linux kernel source: https://sourcegraph.com/github.com/torvalds/linux/-/blob/fs/proc/task_mmu.c?L817:13
To solve this problem, I began searching for an alternative solution and found smaps_rollup just bellow in the source code. This more efficient alternative automatically sums up the data for me, eliminating the need for manual calculation. After replacing my original implementation with smaps_rollup, I was able to achieve an additional 35-40% performance improvement, bringing the runtime down to an impressive 30ms.
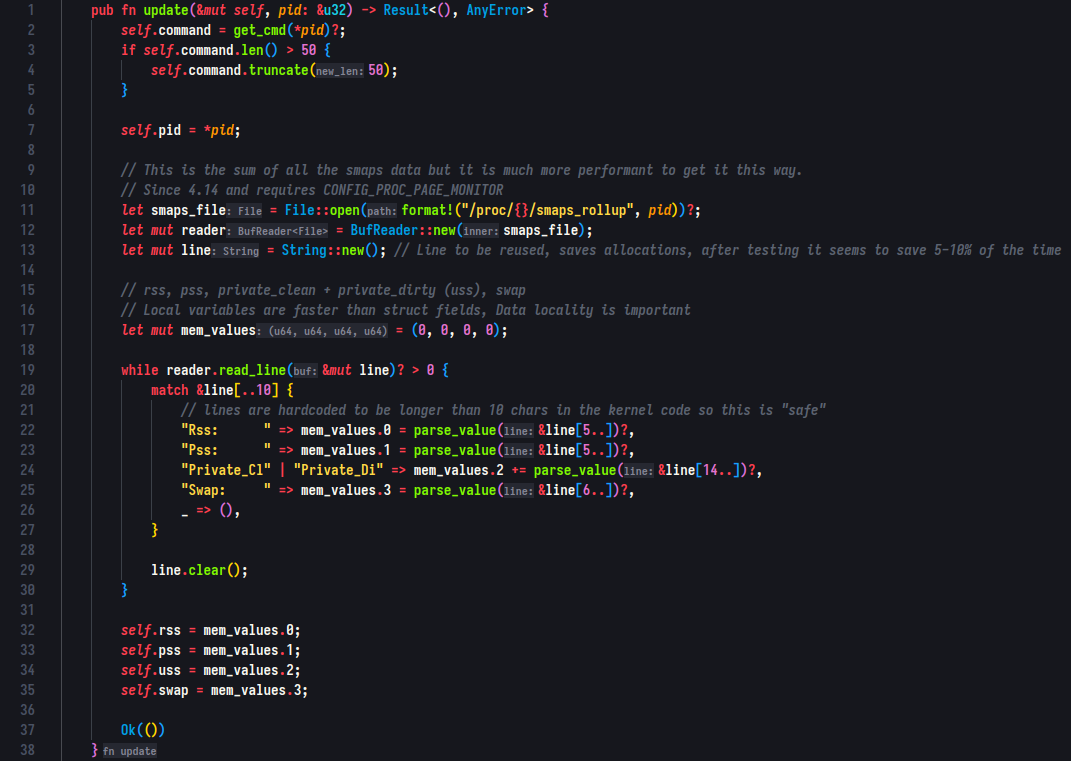
Final version of the method after minor adjustments:
Conclusion:
Throughout this optimization journey, I managed to reduce the runtime of my Rust program zmem from an initial 600ms down to just 30ms. By employing various optimization techniques, such as profiling with Cargo flamegraphs, parallelizing the Update function, improving data locality, reducing reduntant allocations, and switching to alternate ways to get data (smaps_rollup), I achieved a much faster and efficient program.
My experience with Rust has shown me the power of the language, and the optimization possibilities it offers. I’m excited to continue exploring Rust and its performance capabilities, and I hope that my journey in optimizing zmem has provided you with some valuable insights for your own Rust projects.
Happy coding!
Source repo for Zmem: https://github.com/xeome/Zmem